If you can dream it up there is a very good chance we can make it a reality.
Graphics can be used to describe a difficult process visually. They can also make key concepts stand out on a page of text. Infographics help you simplify a complicated subject. Infographics provide the reader with facts and figures in an exciting way. Provide us with the content and/or the data, and we will transform it into a captivating experience.
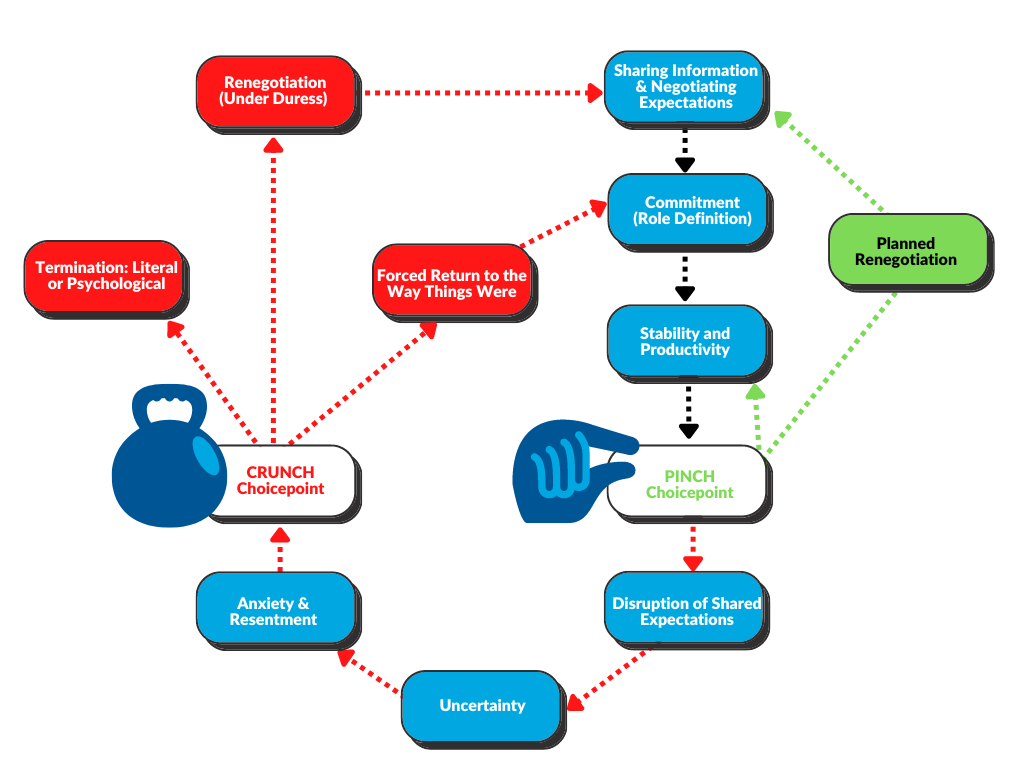
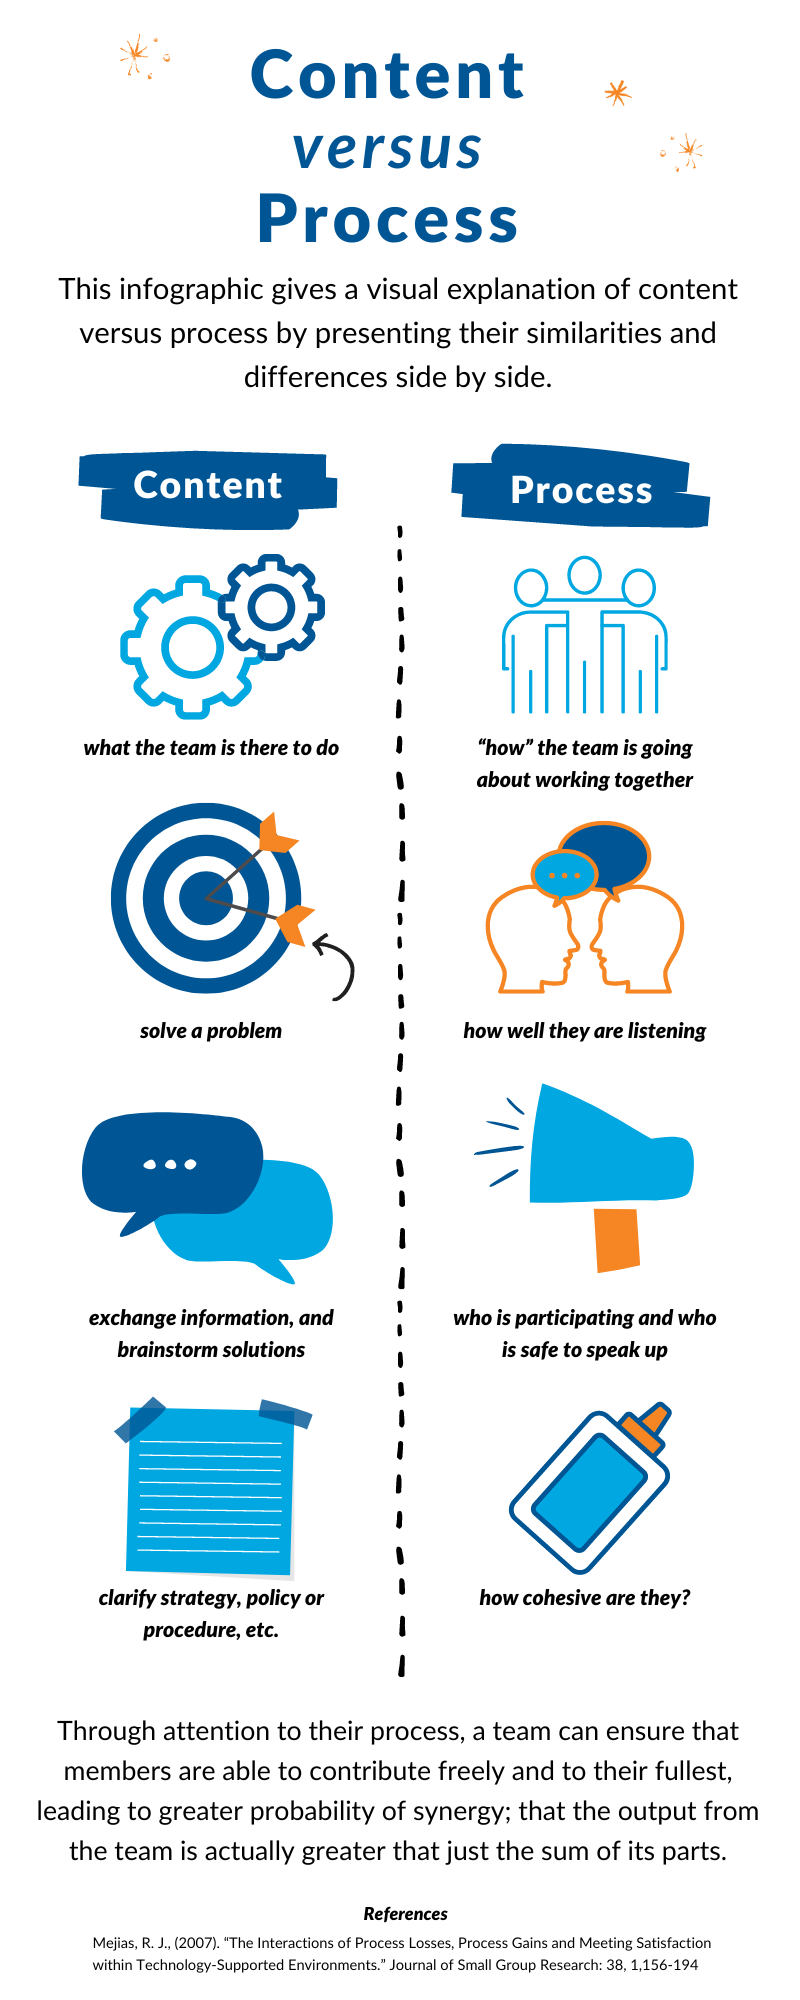
Here are some examples of custom images and graphics we have created for our course developments!